| Area | Freshwater Creek-Ryan Slough |
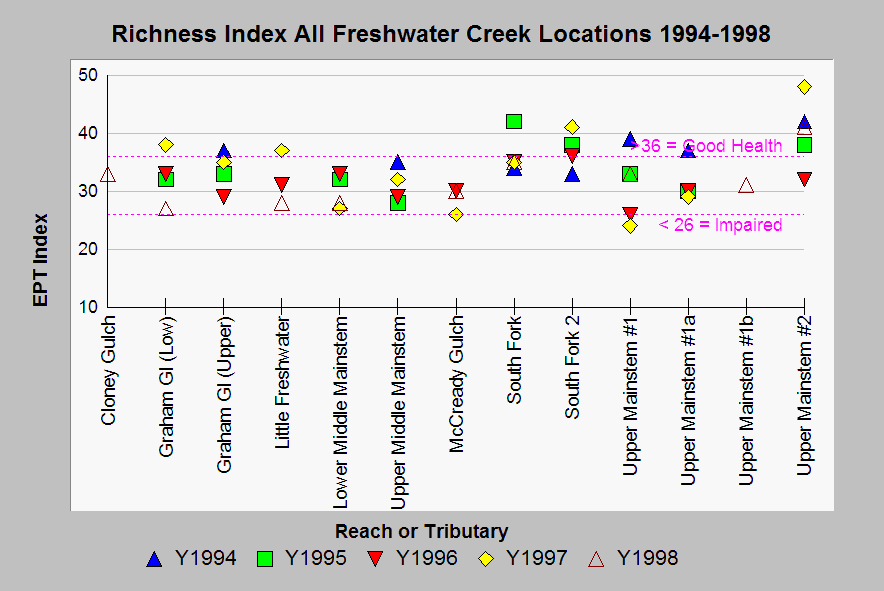
| Topic | Aquatic Insects: Scatterplot All Freshwater Loc. Richness 1994-98 |
| Caption: This chart shows the number of species or taxa richness, which is also termed the Richness index for all Freshwater Creek sites for all years sampled. Harrington (1999) characterized healthy communities as having more than 36 species, while those with fewer than 26 species fall within the range of impaired. Click on the Picture tab to see a map of relative monitoring locations. Data were collected by PALCO. See Info Links for more information on using aquatic insects as indicators. | |
 |
To learn more about this topic click Info Links .
To view additional information (data source, aquisition date etc.) about this page, click Metadata .
To view the table with the chart's data, click Chart Table web page.
To download the table with the chart's data, click richness_all_years_scatter.dbf (size 1,252 bytes)
To download the table with the chart's data as an Excel spreadsheet, click richness_all_years_scatter.dbf.xls (size 5,632 bytes) .
| www.krisweb.com |
