
|
Area/Topic | Bibliography | Background | Hypotheses | Home |
|
Map Page.
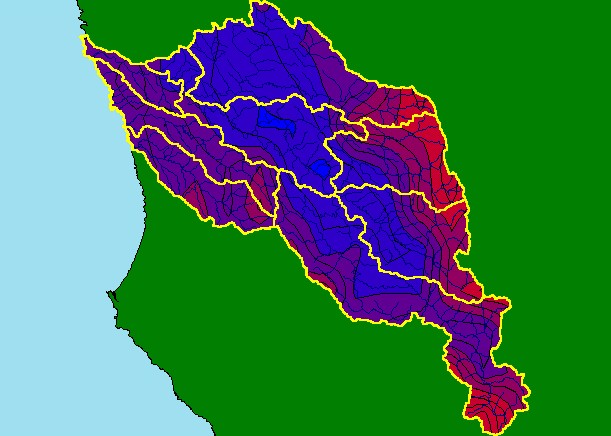
You selected the area Basinwide and the topic Map: 1D Rainfall, Navarro Project Area |
| This is a map of annual rainfall in the KRIS Navarro Project Area. Note that rainfall patterns are greatest in the east and west of the watershed where elevation is highest. As storms pass over higher spots the cool air increases precipitation in what is known as the orographic effect. Click on the elevation theme and see the conformance. Rainfall model is derived by Oregon State University. Scale = 1:426,416 . | |||
|
|
||
To view metadata about a map layer, click on a link in the table below.
| Name of Layer in Map Legend | Metadata File Name |
|---|---|
| Sub-basins (no labels) | subbasins.shp.txt |
| Streams (1:100k scale) | streams100.shp.txt |
| Project Frame | Unavailable |
| Annual Rainfall (inches) | rain61_90.shp.txt |
| Elevation (10 m resolution)(TIFF) | elev10.tif.txt |
| Topo Map (1:24k Scale) | Unavailable |
| Project Background | Unavailable |
| www.krisweb.com |