
| Area | Basinwide/General |
| Topic | Ten Mile River Basin Maps: Geology and Hydrology |
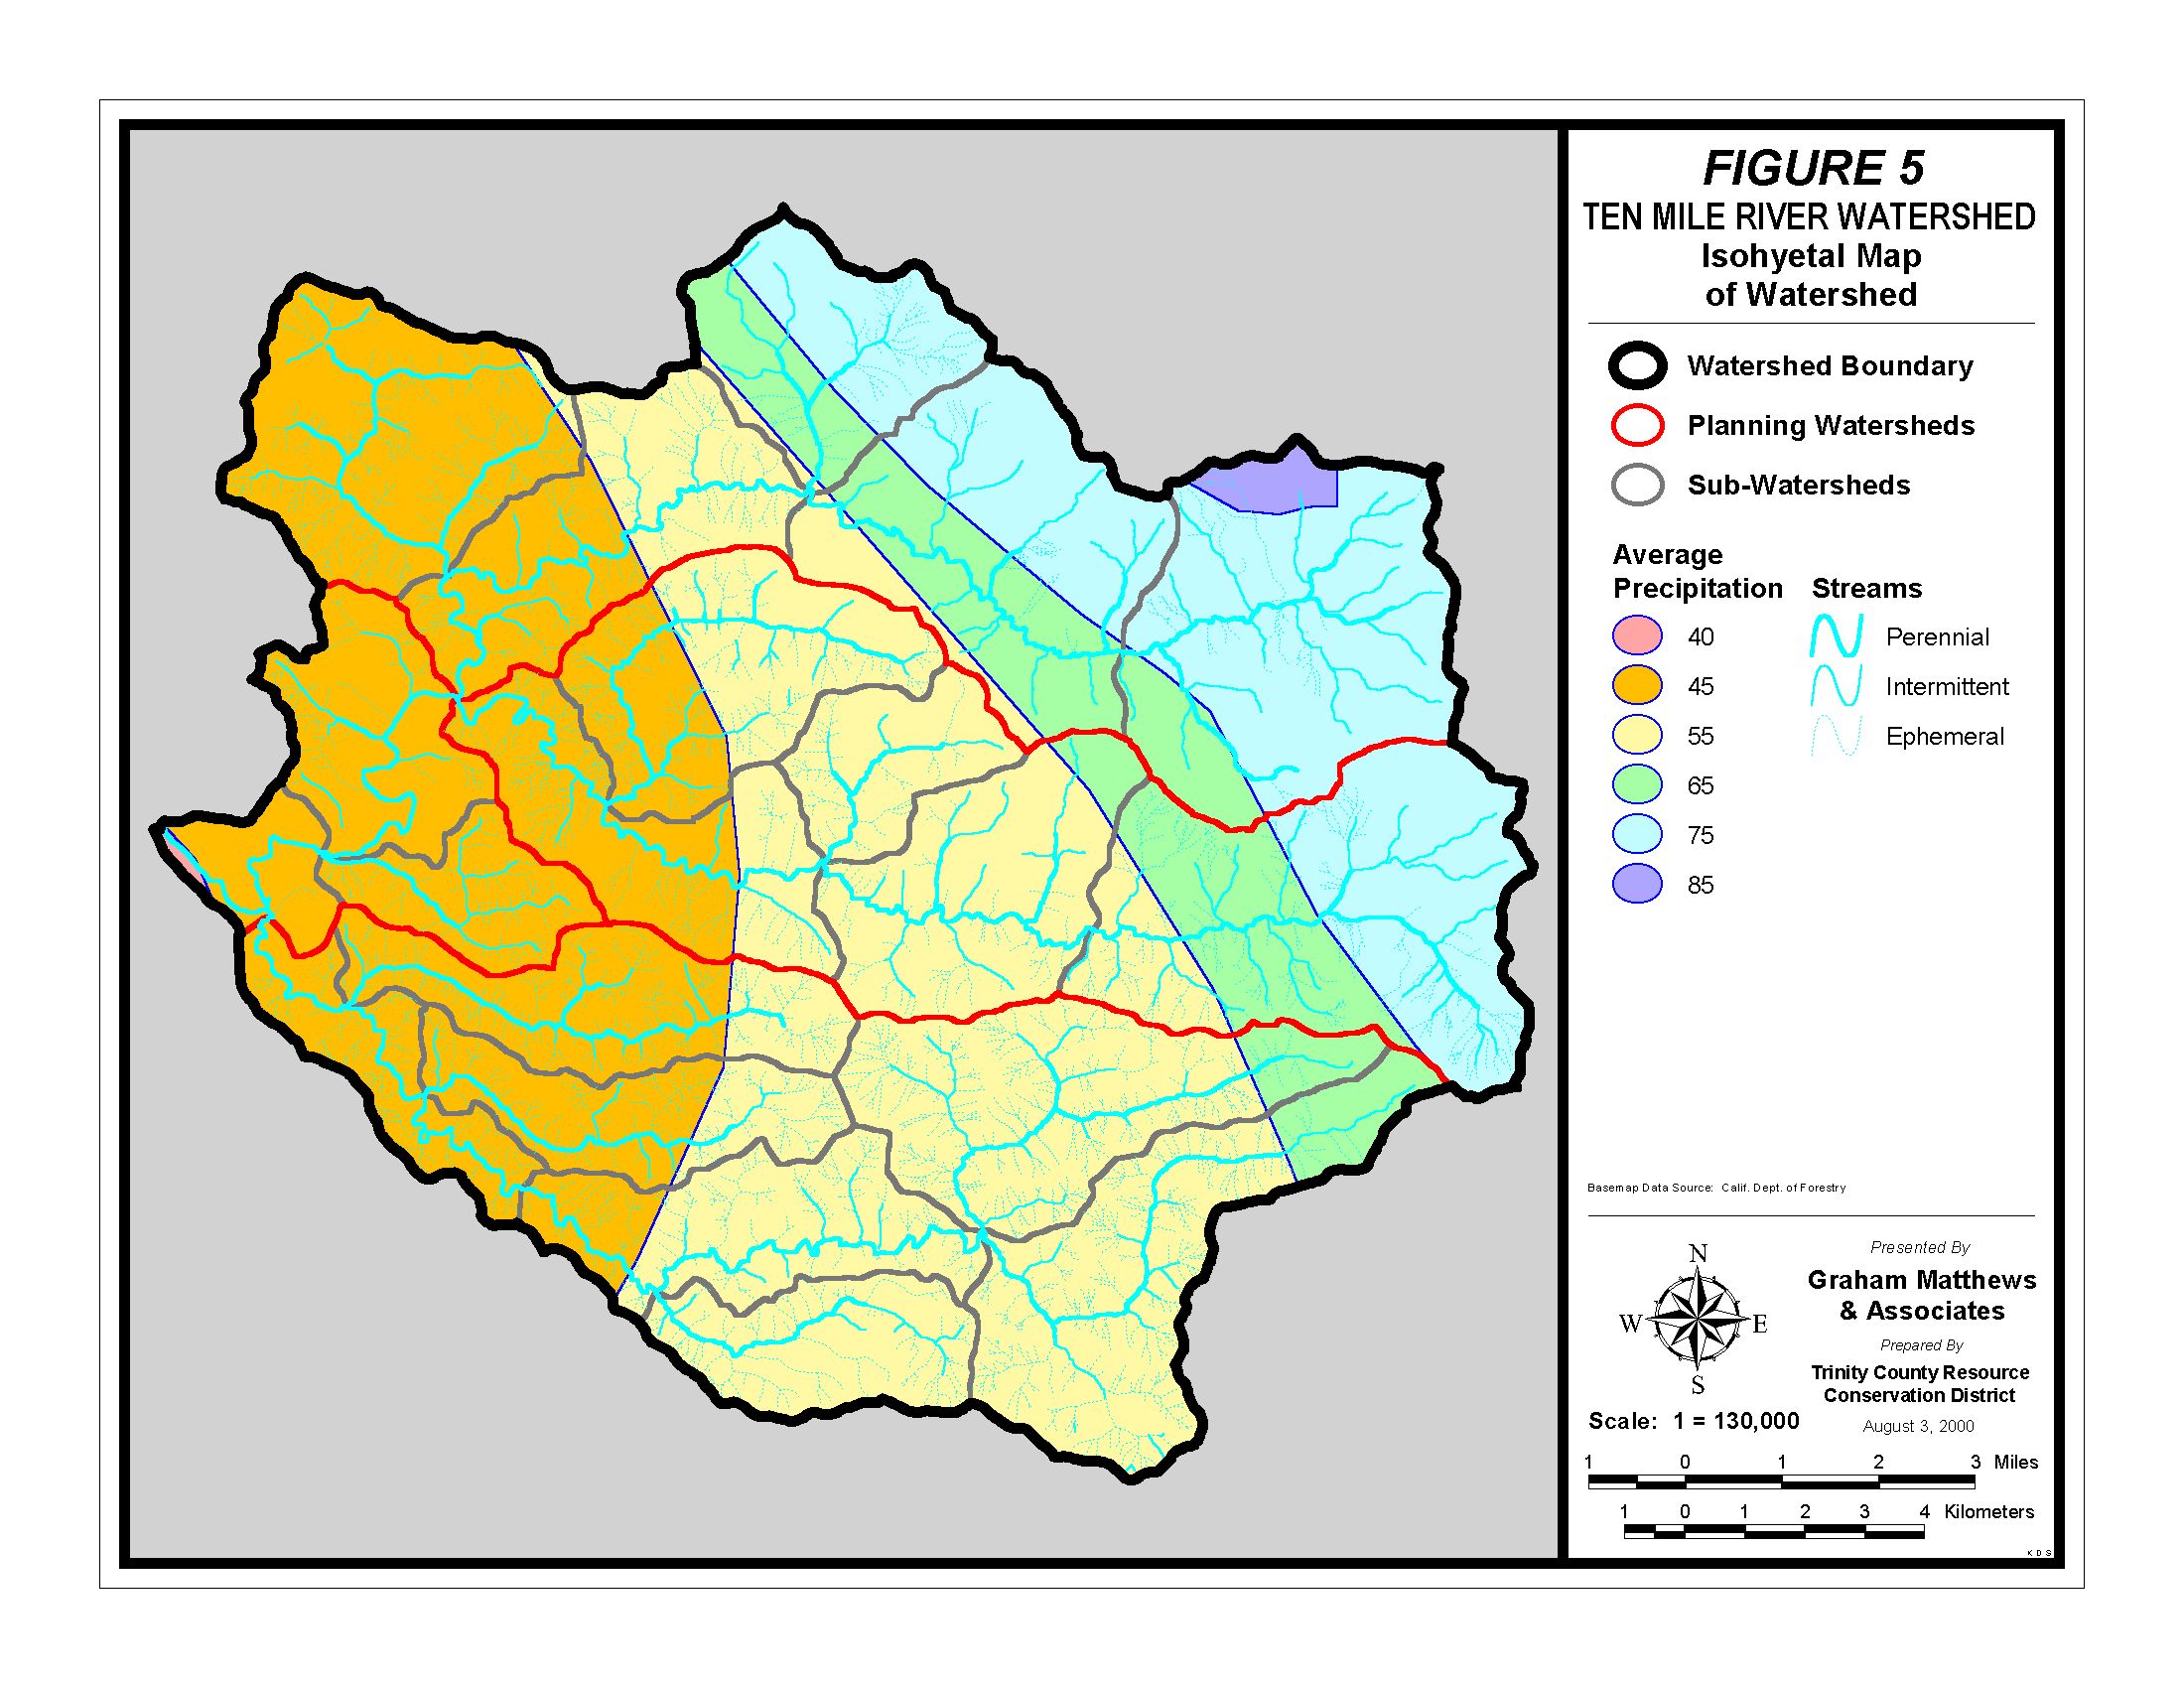
The map is taken from Matthews and Associates (2000) and shows the rainfall patterns of the Ten Mile River basin based on rainfall data collected between 1900 and 1960. The steeper portions of the watershed to the east receive the highest rainfall with some areas topping 85 inches while the coastal plain gets about 45 inches in an average year..
The map above shows stream gradient for the Ten Mile River basin as derived from 10 meter DEM data. Stream reaches with a gradient below 2% which were not blocked by barriers would have been optimal habitat for coho salmon before watershed disturbance. Steelhead may inhabit reaches up to 4% in gradient. Image taken from the KRIS Ten Mile Map project.
The geology map for the Ten Mile River basin above is based on information provided by the California Division of Mines and Geology. It shows marine terraces to the west along with dunes. Most of the Ten Mile basin is dominated by the Coastal Belt Franciscan formation with some Central Belt Franciscan intruding into the basin in the northeast. River deposits can be seen as quaternary alluvium. Map from the KRIS Ten Mile Map ArcView project.
The image above shows the soil erodibility in the Ten Mile River basin according to a Natural Resource Conservation Service 1:24000 Mendocino County soil map. This map layer is in the Geology view of the KRIS Ten Mile Map ArcView project. The erodibility rating is based on detachability of soil particles and slope steepness (kkfact).
The percent slope for the Ten Mile River basin is shown above on a backdrop of a gray scale shaded relief model. Highest slope steepness is in the northern portions of the watershed in the Little North Fork and Bald Hill Creek Calwaters and in a band that extends across the Mill Creek and Campbell Creek planning areas. Taken from the KRIS Ten Mile Map project.
The map above shows road construction by period as reconstructed by Matthews and Associates (2001) from aerial photos from different eras. The road network was significantly expanded in the period between 1988 and 1999. Image taken from the KRIS Map ArcView project. The U.S. Geologic Survey 1:24,000 DRG roads are also displayed. Matthews mapped roads only in the Ten Mile basin proper while the area for the KRIS project extends to smaller basins to the north and south.
The landslide and geohazard map for the Ten Mile River basin above is based on information provided by the California Division of Mines and Geology. It shows widespread areas of geologic instability throughout the watershed but the most unstable areas are in the Upper Middle Fork and Booth Gulch Calwaters. Map from the KRIS Ten Mile Map ArcView project.
Matthews and Associates (2001) mapped active landslides from sequential aerial photos and they are displayed above. The most active slides seem related to the first round of timber harvest in 1941 and following the 1964 storm. Slides in the northern portion of the basin were also extensive in the period prior to 1978.
 Click on image to enlarge (498K).
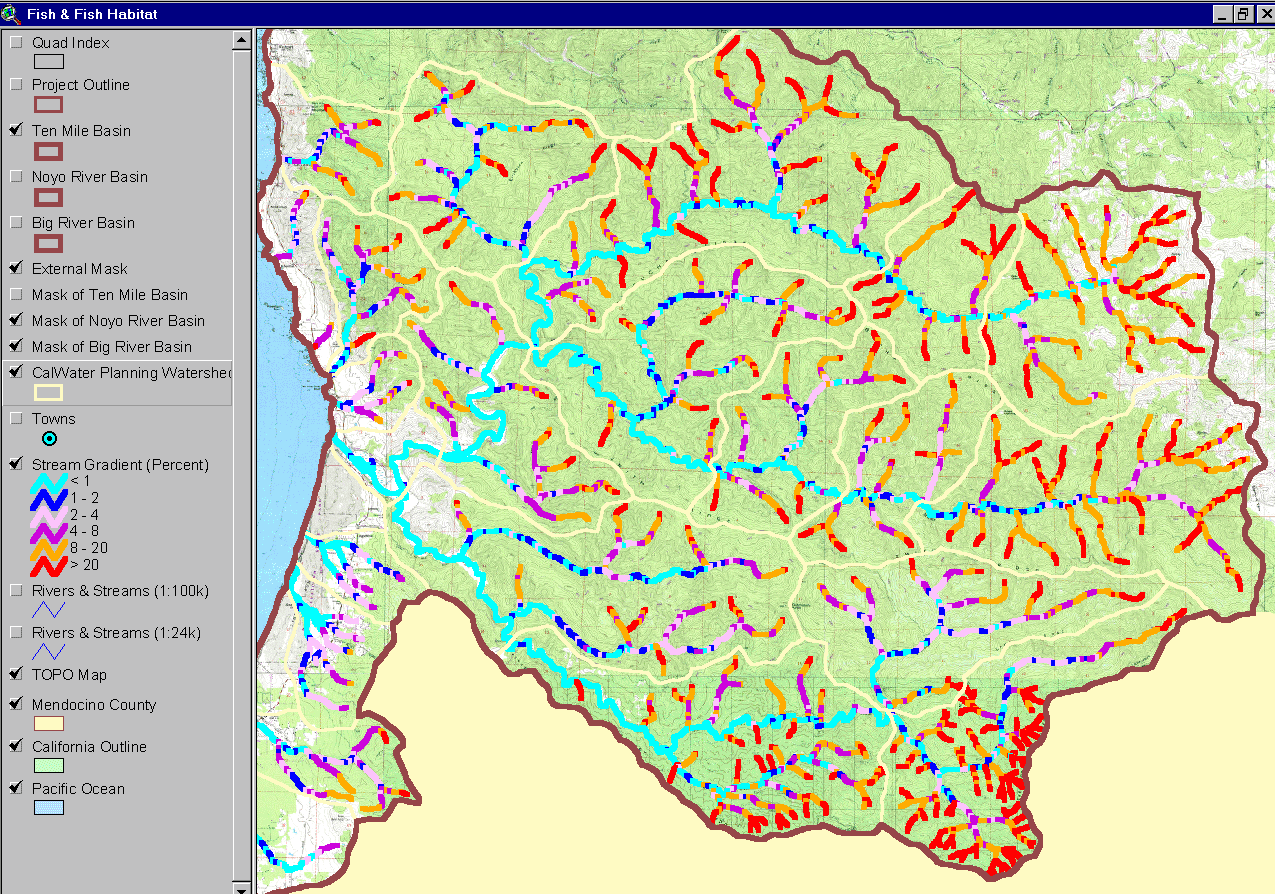 Click on image to enlarge (405K).
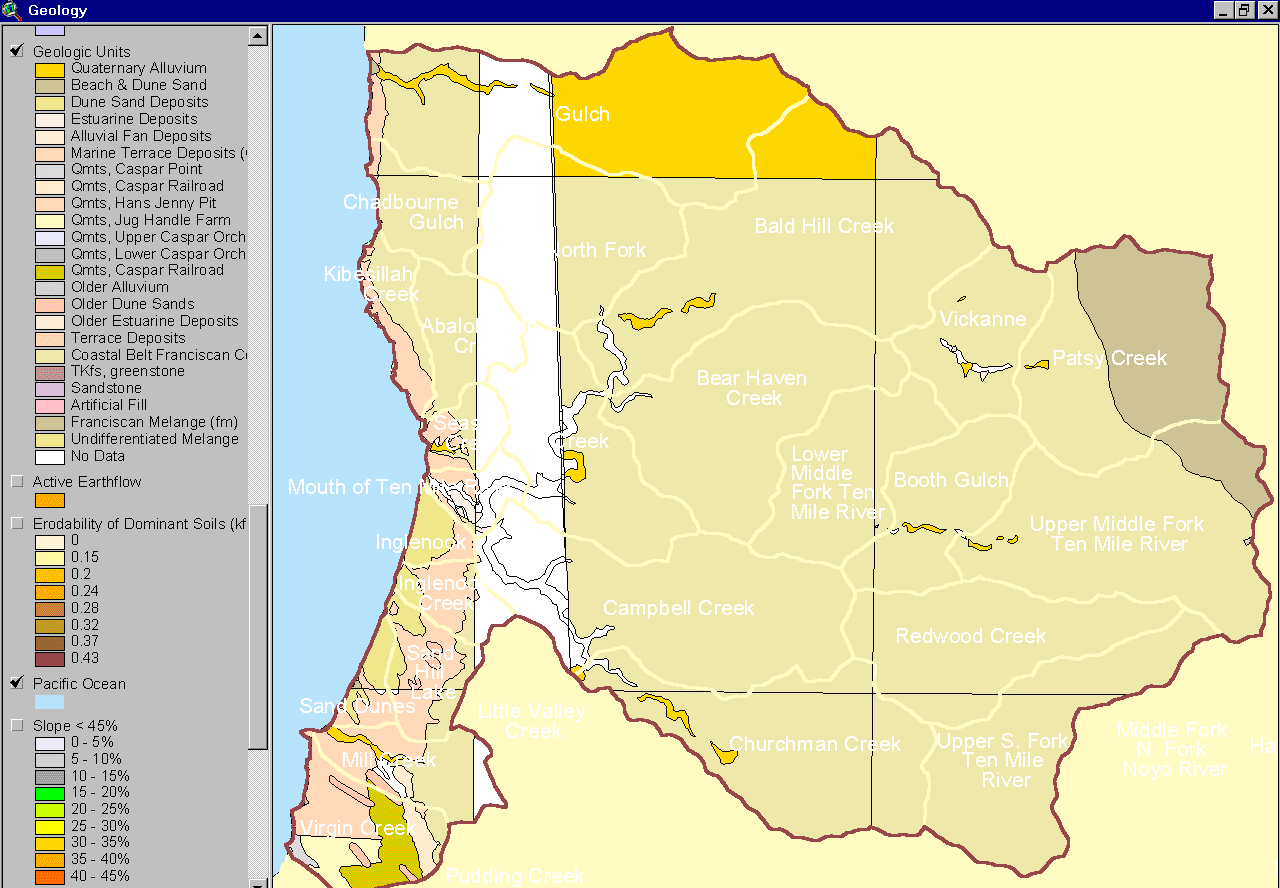 Click on image to enlarge (70K).
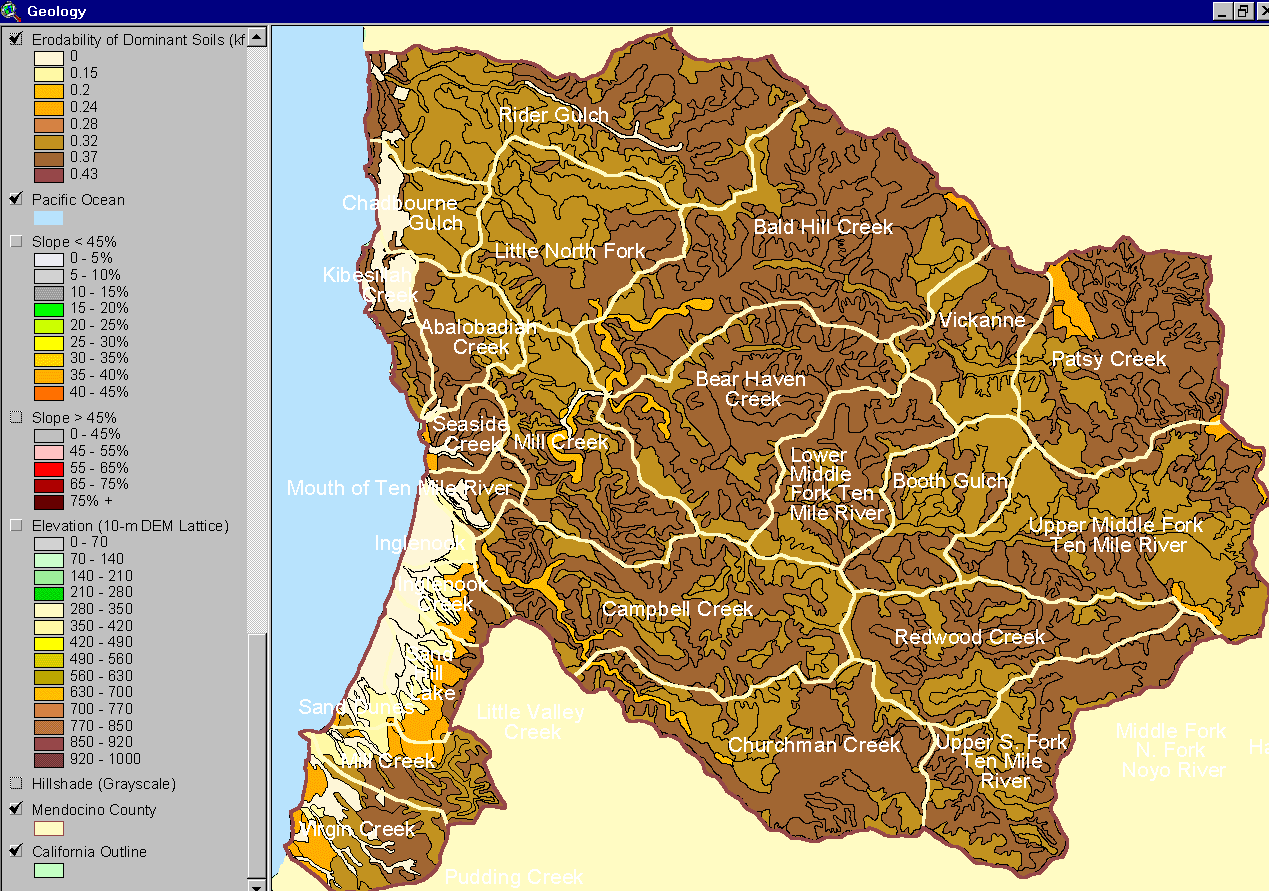 Click on image to enlarge (110K).
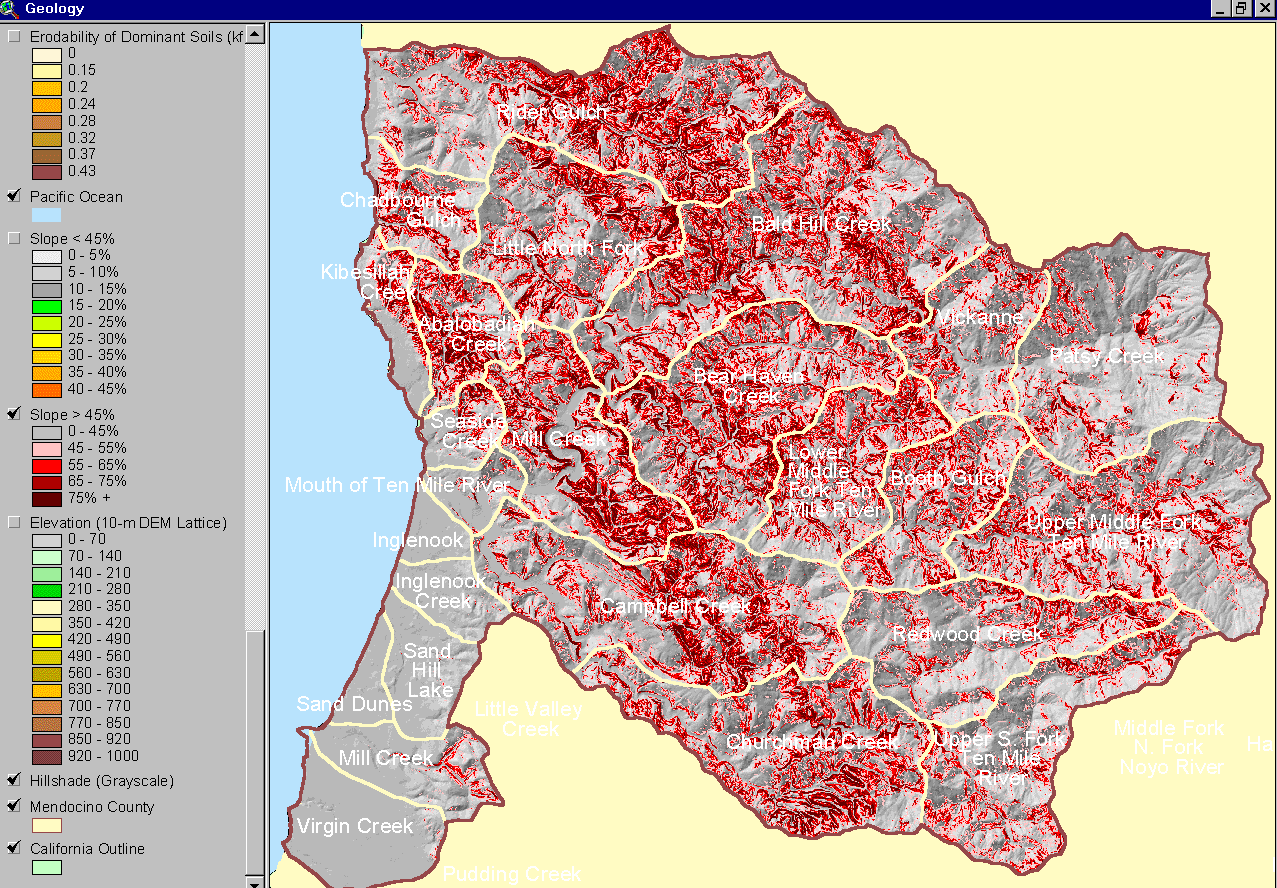 Click on image to enlarge (267K).
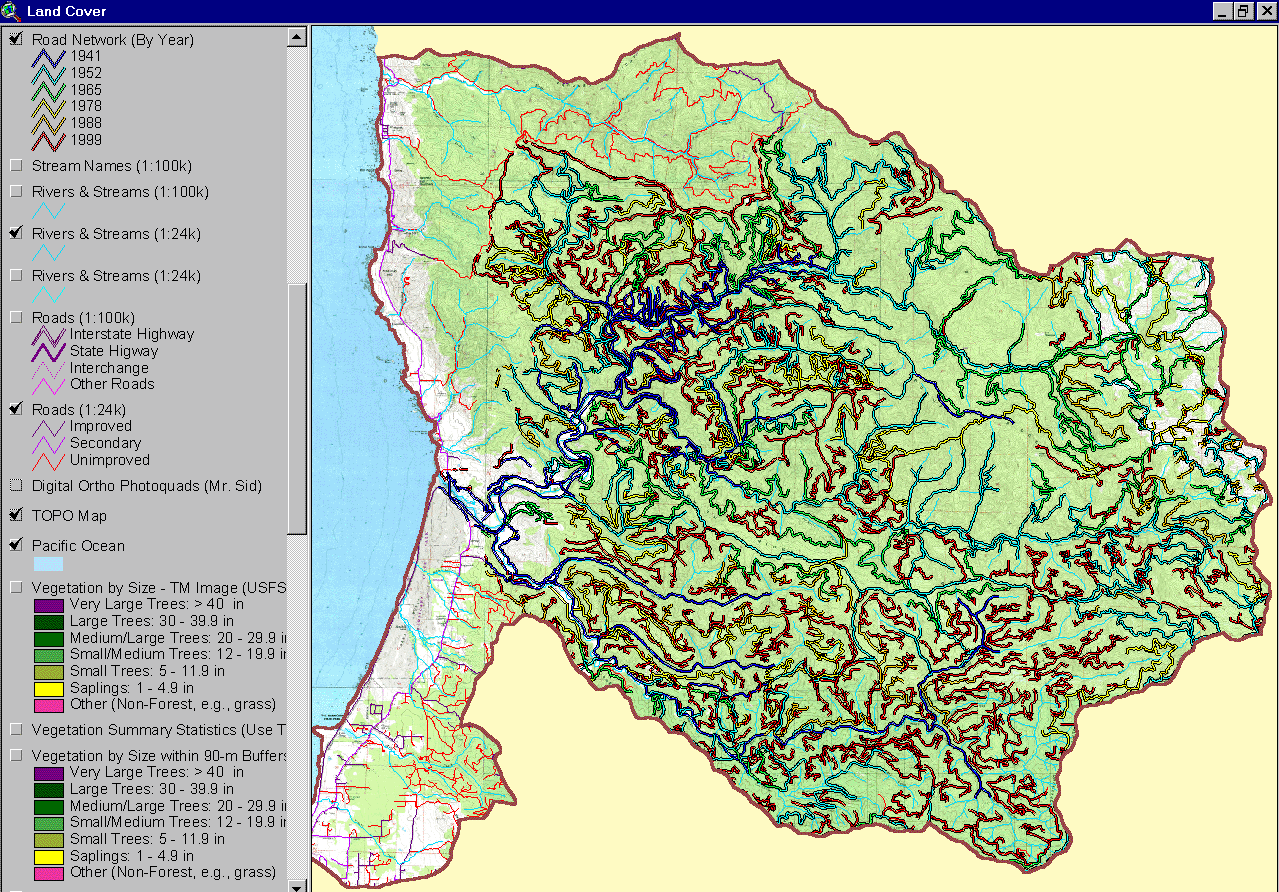 Click on image to enlarge (375K).
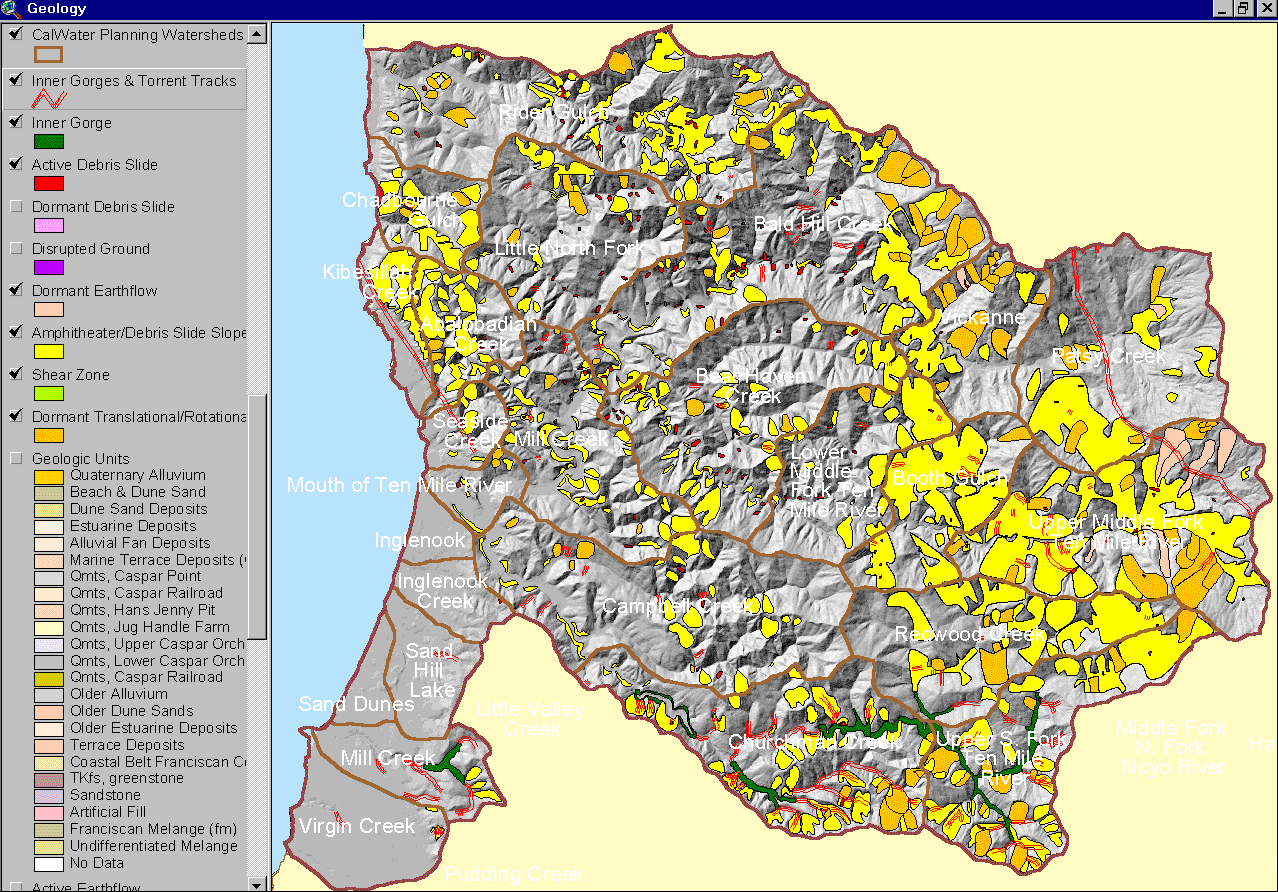 Click on image to enlarge (242K).
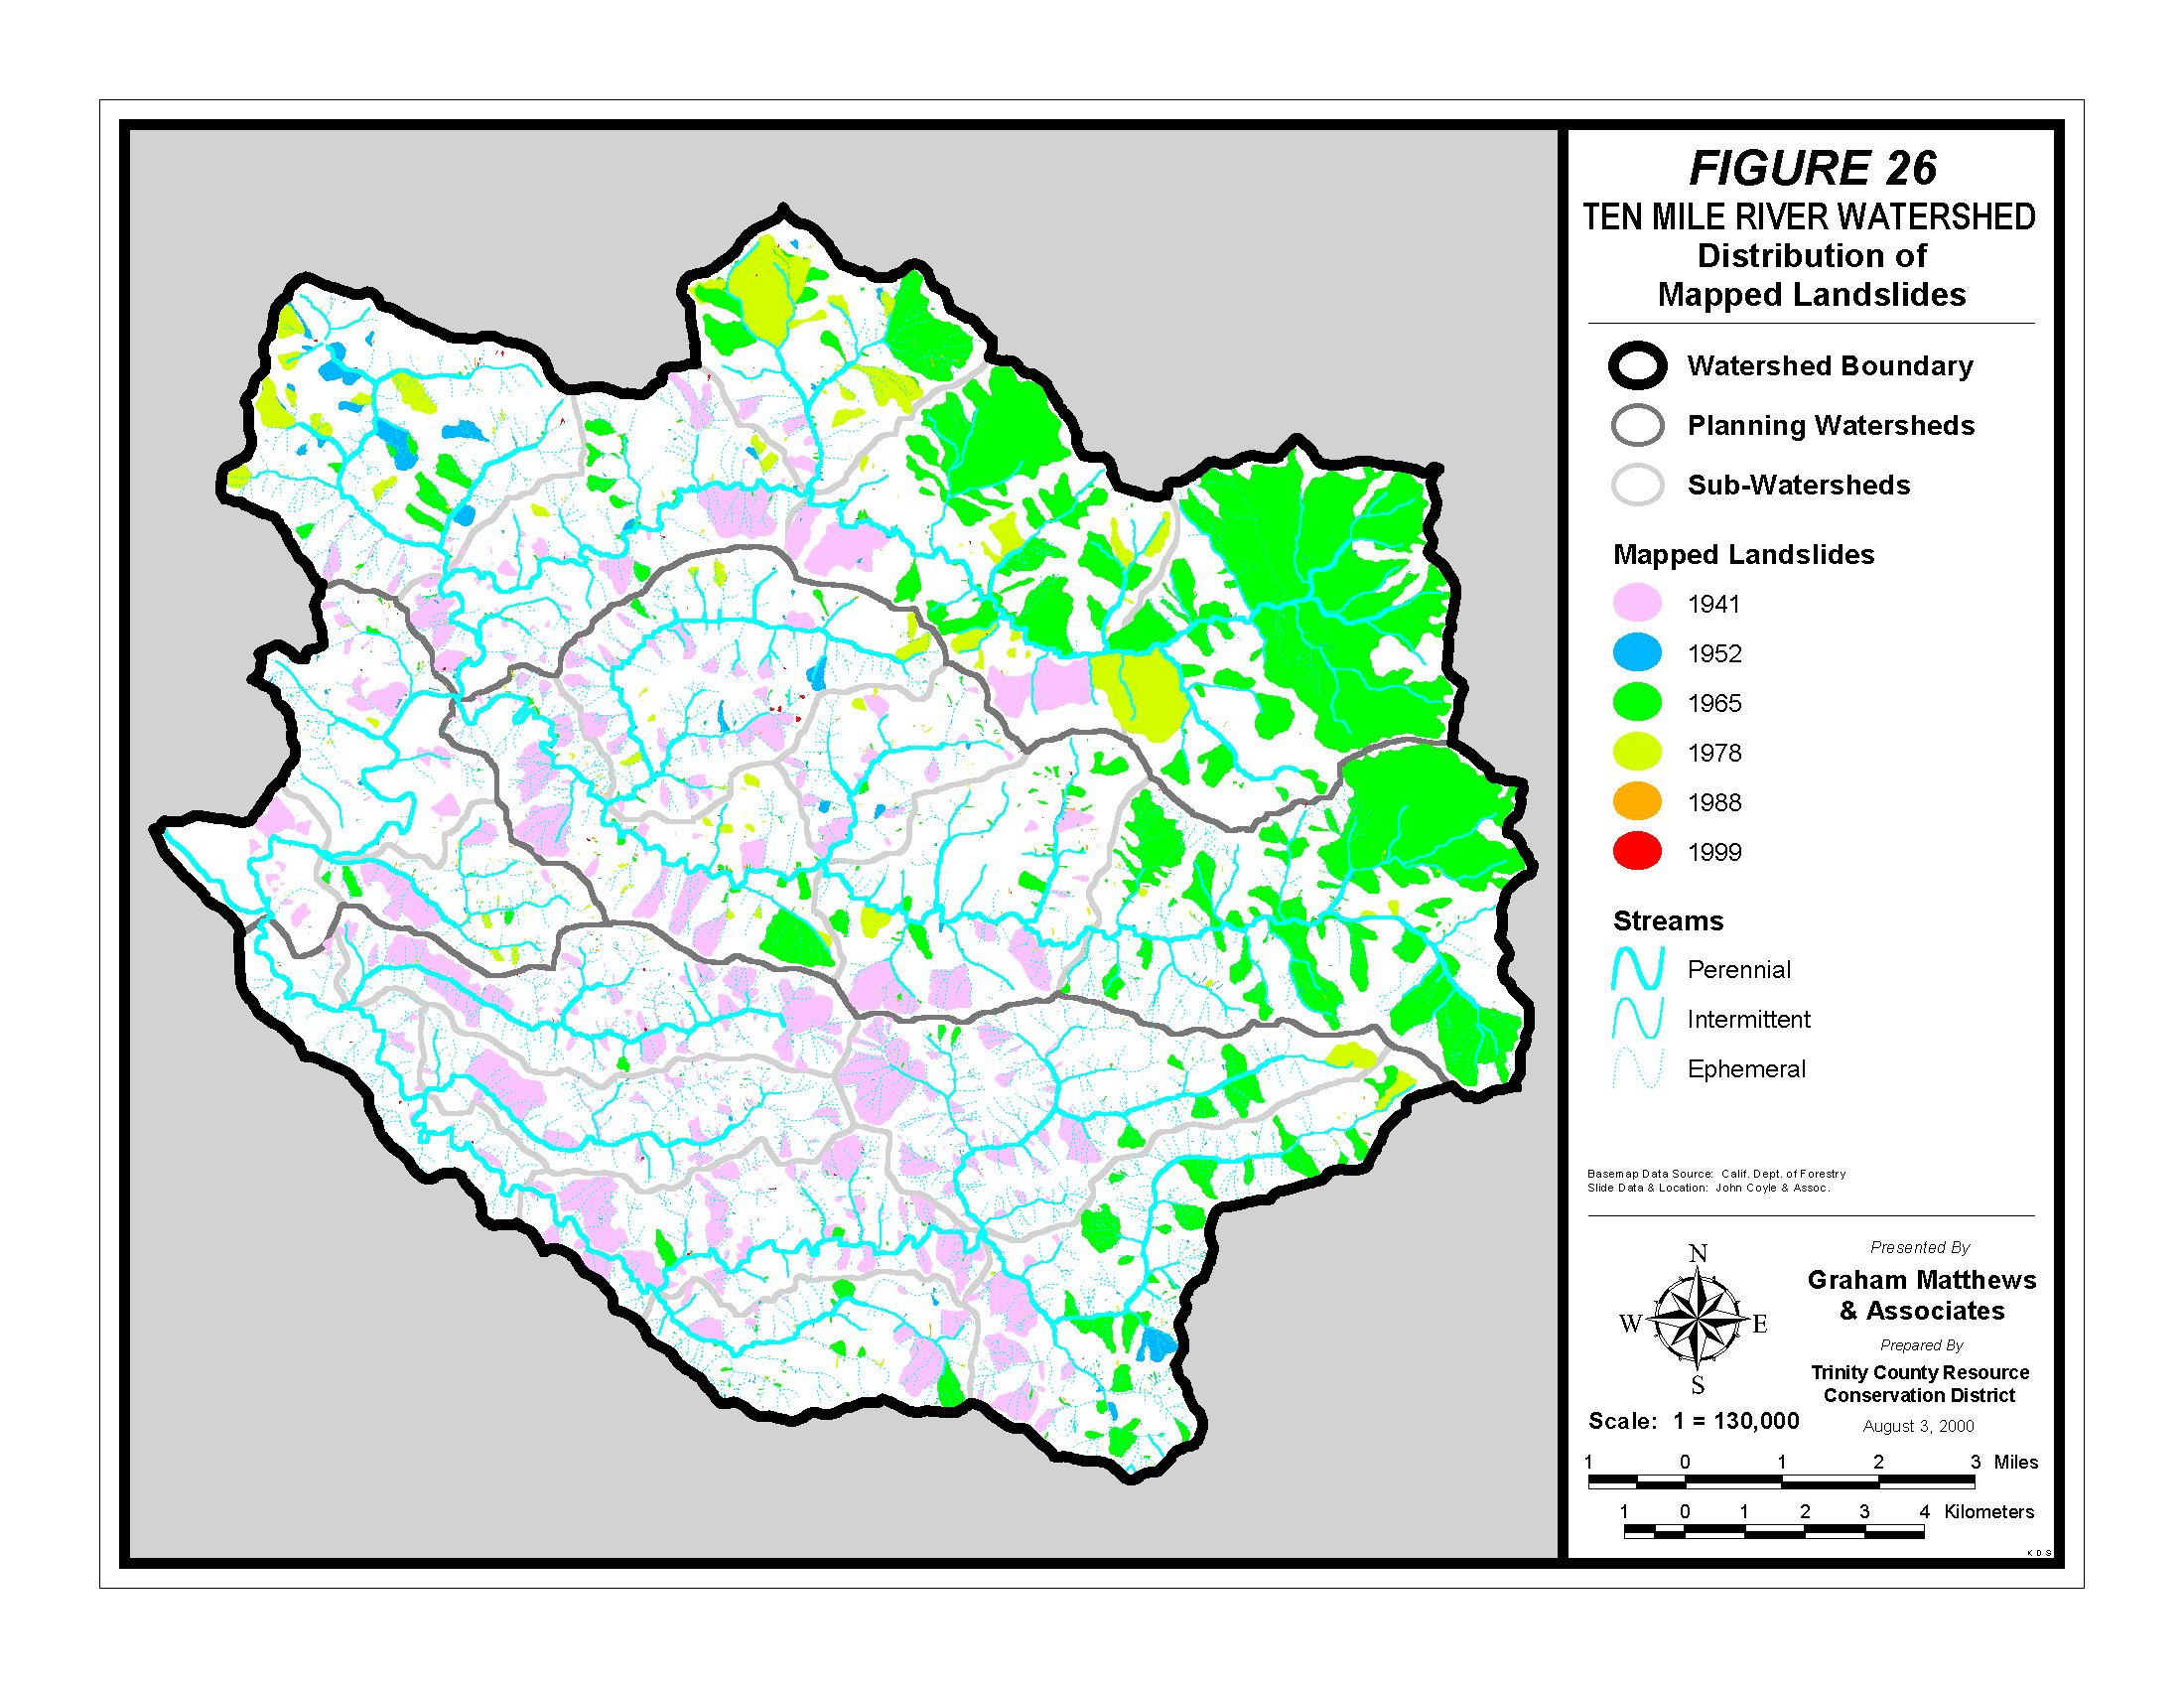 Click on image to enlarge (568K).
To learn more about this topic click here
| www.krisweb.com |