
|

|
| Background | Hypotheses | Bibliography | Maps | Home |
|
|
|
| Background | Hypotheses | Bibliography | Maps | Home |
KRIS Web Background Pages: Roads and Erosion
![]()
Road densities in KRIS Noyo are taken from Matthews (1999) and were calculated from aerial photographs taken at different time periods and from California Department of Forestry (CDF) information about recent timber harvest plans that include new roads. Road density values in KRIS are compared to a threshold of 3 miles of road per square mile, which is taken from the National Marine Fisheries Service (1996) working guidelines for salmon conservation The guidelines characterize watersheds over this threshold as "not properly functioning". Road densities in the Noyo Basin average 6.7 miles per square mile. KRIS charts show roads per square mile by sub-basin and maps from Matthews (1999) which show road densities.
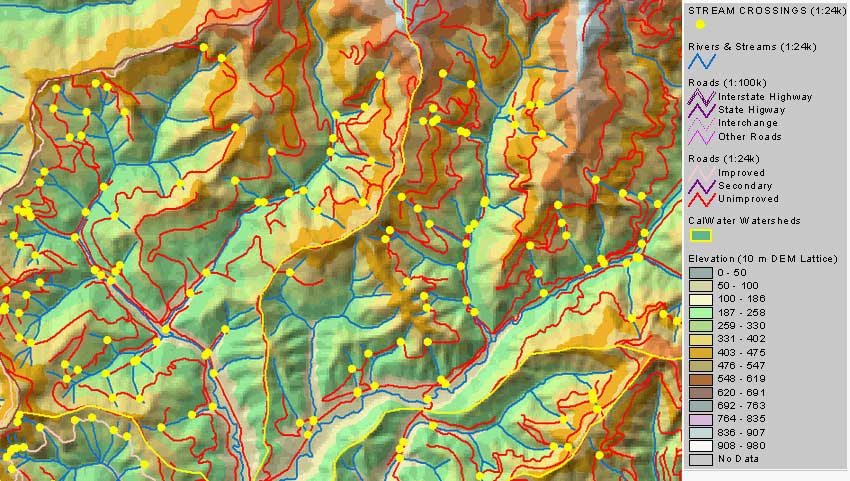
The KRIS Noyo Map project incorporates spatial road data from the California Department of Forestry. Road density calculations from the CDF data yield lower values than those given by Matthews (1999), because Matthews included roads scheduled for construction. IFR staff used intersections of stream and road coverages to generate stream crossing data. Variability of the 1:24000 USGS hydrography maps make crossings look more numerous in areas with a higher mapped stream density.
Data in KRIS Noyo and ArcView samples from the KRIS Noyo Map project are displayed below.
 |
This map, from Matthews (1999), shows the period in which roads were built in the middle Noyo basin. Roads were mapped from aerial photographs from different periods. This is a free-standing ArcView coverage.
|
|
|
| The chart above shows the number of miles of road constructed by period as calculated by Matthews (1999). Noyo River Basin road densities have increased dramatically in the in association with intensive logging during the last 15 years. | Matthews (1999) calculated the increase in sediment related to roads in the Noyo River Basin by period and this data is captured in KRIS Noyo. |
The chart above shows density of roads in South Fork Noyo River sub-basin watersheds as calculated by Matthews (1999). Road densities in watersheds under the jurisdiction of Jackson Demonstration State Forest are fairly low, while those in industrial timberland ownership are well over thresholds expected to deliver fine sediment to streams.
![]()
References
Matthews & Associates. 1999 . Sediment source analysis and preliminary sediment budget for the Noyo River. Weaverville, CA. (Contract 68-C7-0018. Work Assignment #0-18.) Prepared for Tetra Tech, Inc. Fairfax, VA.
![]()
| www.krisweb.com |