Bibliography Background About KRIS
Vegetation Types
The vegetation and timber types used in KRIS projects were derived from Landsat multi-spectral images taken in 1994. The U.S. Forest Service Pacific Southwest Regional Remote Sensing Lab, in cooperation with the California Department of Forestry, analyzed the Landsat images to formulate a California-wide electronic map layer of vegetation as part of the Northwest Forest Plan (Warbington et al., 1998). The vegetation classification was extensively checked using a number of different methods as described by Warbington et al. (1998):
"Ground-based field observations, existing vegetation samples, aerial photography, digital ortho photography, SPOT imagery and field review of draft maps were all used in validating and correcting classification and modeling errors where observed."
The resolution of Landsat images is about 30 meters and each square in the grid coverage is referred to as a pixel. The USFS vegetation coverage characterizes stand conditions and is not accurate to the pixel level. Stand conditions are accurately represented at the one hectare scale. See Schwind (1999) for a full discussion of methods and how problems such as topographic shading were corrected for. The USFS data is queried for tree size or community type in KRIS Maps. This allows quantitative assessment of vegetation types for seral stage based on tree size for geographic areas such as Calwater planning watersheds. In the most recent KRIS projects (Navarro, Garcia, Russian, West Marin-Sonoma), data from 1999 were also included along with the 1994 data.
For use in KRIS, one of the simpler vegetation and timber type classifications was chosen with 10 categories. Vegetation classifications are:
| Size Class/Vegetation Type | Diameter of Trees |
| Very Large Trees | 40" in diameter or greater |
| Large Trees | 30-39.9" in diameter |
| Medium/Large Trees | 20-29.9" in diameter |
| Small/Medium Trees | 12-19.9" in diameter |
| Small Trees | 5-11.9" in diameter |
| Saplings | 1- 4.9" in diameter |
| Non-Forest | Non-tree species such as shrubs, grasses or bare soil |
This simpler classification provides an easy to understand index of watershed disturbance for use in coastal watersheds. Large components of early seral stage conditions (Saplings, Non-Forest) are often associated with recent logging disturbance, although upland areas can sometimes be natural grasslands. The vegetation patterns in interior basins, such as the Eel River and Klamath River watersheds, are much more complicated than in coastal ecosystems and more difficult to use to analyze changes in vegetation brought about by watershed management activities.
 The KRIS vegetation classification scheme can also be used for a quick analysis of riparian conditions. Ninety meter (297 ft.) zones of riparian influence are assigned to the 1:24000 stream layer in ArcView and only the vegetation within this zone is displayed and analyzed.
Ninety meter (297 ft.) zones of riparian influence are assigned to the 1:24000 stream layer in ArcView and only the vegetation within this zone is displayed and analyzed. The image at left shows the riparian zone of Jackson Demonstration State Forest (JDSF) compared to adjacent industrial timber land.
The California Department of Forestry Forest and Range Assessment Program has also conducted a joint exercise with the USFS Spatial Analysis Lab to show the changes in the landscape between 1994 and 1998, based on Landsat data (Fischer, 2003). This process, called change scene detection (Levien et al, 1999), is very useful in KRIS Map projects because it helps update vegetation coverages that were based on 1994 imagery. The rapidity of change in vegetation of in some northwestern California watersheds makes the 1994-1998 interval particularly useful for analysis. The map at left shows little change in vegetation in the JDSF portion of the watershed.
Examples of several seral types and from KRIS Maps.
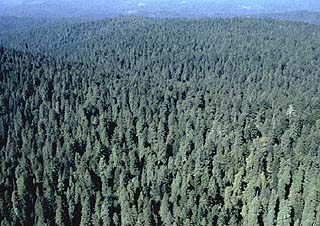 In the late seral Headwaters Forest of Humboldt County, trees are mostly in the very large (>40 inches) and large (30-39.9" in diameter) categories. Late seral forests show up in the KRIS Maps as deep purple interspersed with dark green. There is very little representation of these larger tree types in the KRIS Mendocino project area.
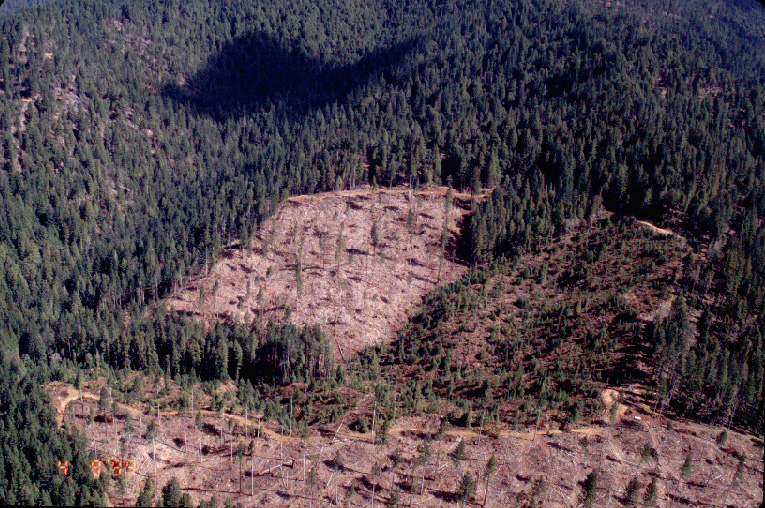 (Right) This aerial photo of Jackson Demonstration State Forest, in the South Fork Noyo River drainage, shows a recent seed-tree-removal type harvest. The vegetation classifications in this area would be Non-Forest for the recent clear cuts (pink) and Saplings (1-4.9" diameter) for the area between the two recent harvests (yellow). The balance of the area would show as Small (5-11.9"), Small/Medium (12-19.9") and Medium/Large (20-29.9") trees. Photo by Graham Matthews.
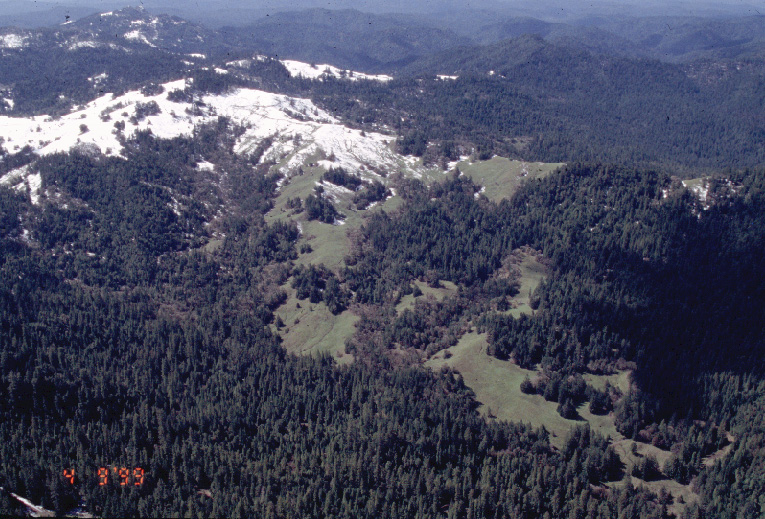 The natural grassland area in the headwaters of the Noyo River shows as Non-Forest (pink). Grassy areas may have been cleared of forests or may be naturally occurring as a result of geology and soil types. Photo by Graham Matthews.
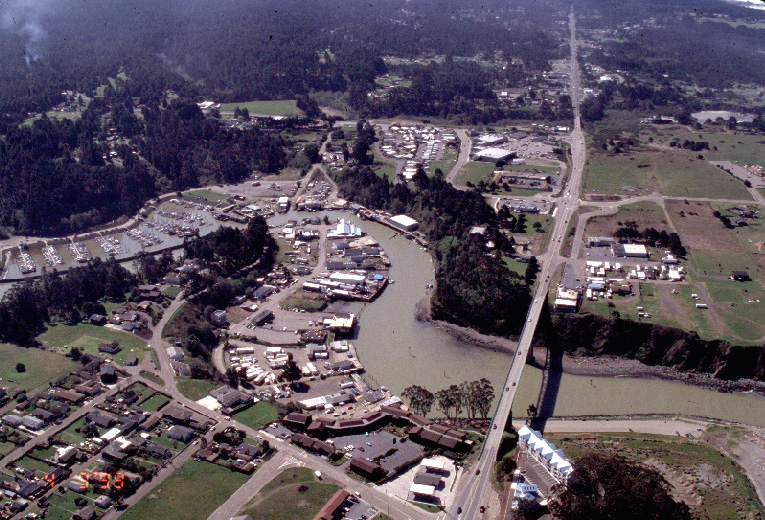 The city of Fort Bragg is in the Lower Noyo River Basin or Mouth of the Noyo Calwater unit. Much of the vegetation analysis for this area registers Non-Forest.
 U.S. Geologic Survey ortho photoquads for the Duffy Gulch Calwater in the Middle Noyo Basin. Much of Duffy Gulch has undergone recent timber harvest as indicated by lighter parts in the photo and other areas are in early succession with shrubs or other non-forest components. Image taken from KRIS Noyo Map project.
 Shown at right is the USFS vegetation stand characterization using tree size as the main classification scheme. Much of the Duffy Gulch Calwater is Non-Forest (pink) as shrubs or grasses colonize or soil remains bare. Saplings (1-4.9" diameter/yellow) are also a dominant vegetation class in this basin but Medium/Large (20-29.9" diameter/green) are also well represented. Small trees (5-11.9" diameter/olive) and Small/Medium trees (12-19.9" diameter/light green) are represented in lesser amounts. From KRIS Noyo Map project.
 Changes in vegetation between 1994 and 1998 based on Landsat imagery are displayed at left for the Stewart Creek Calwater, which is actually the middle reach of the North Fork Gualala River. Changes in canopy were mostly in the direction of canopy reduction, indicating intense timber harvest over a substantial area in just four years. From the KRIS Gualala Map project. 84 KB.
References
Fischer, C. 2003. Monitoring Land Cover Changes in California, North Coast Project Area (1994-1998). California Department of Forestry FRAP and USFS Spatial Analysis Lab, Sacramento, CA. http://frap.cdf.ca.gov/projects/land_cover/monitoring/pdfs/nccdp_report_final.pdf
USDA Forest Service Remote Sensing Lab. A machine-learning approach to change detection using multi-scale imagery. CDF FRAP and Pacific Maridian Resources, Sacramento CA.
Schwind, B. 1999. USFS Thematic Mapper Landsat Vegetation Coverage Background Information. USDA Forest Service. Pacific Southwest Region Remote Sensing Lab. Sacramento, CA.
Warbington, R., B. Schwind, C. Curlis and S. Daniel. 1998. Creating a Consistent and Standardized Vegetation Database for Northwest Forest Plan Monitoring in California. USDA Forest Service. Pacific Southwest Region Remote Sensing Lab. Sacramento, CA.